SData has launched the Maycee Retail Dataset, a synthetic Australian retail data product for practical data, analytics, and AI work. It gives practitioners a realistic environment for building and testing solutions without exposing customer records or commercially sensitive production data.
This article starts with the free public release and shows one concrete use case: loading its Parquet files with a pure Python stack and building an interactive retail dashboard locally. The goal is not to reproduce a large BI platform. It is to show how quickly a documented data product can become useful analysis.
What Maycee Retail Provides
Maycee Retail models an enterprise-style retail environment rather than a single flat spreadsheet. Its 13-table schema includes transactions, line items, returns, and dimensions for dates, regions, districts, suppliers, brands, categories, customers, stores, products, and promotions.
The data is delivered as daily partitioned Parquet files and includes documented metadata, natural-language fields, and data-quality scenarios. This makes one dataset useful across several roles:
| Practitioner | Example work |
|---|---|
| Data practitioner | Explore a connected retail model with Python and SQL |
| Data analyst | Compare revenue, margin, customer, category, and return patterns |
| Data engineer | Test Parquet ingestion, partition handling, joins, and validation |
| Data scientist | Prototype features, seasonal analysis, and return-risk ideas |
| Business analyst | Build KPI definitions and investigate regional or category performance |
Because the records are synthetic, the dataset can support demonstrations, training, prototyping, and evaluation without substituting a toy dataset for realistic data engineering concerns.
Start with the Free Hugging Face Release
The Maycee Retail free dataset on Hugging Face covers 2017 through 2019 under CC BY 4.0. It contains 1,095 daily partitions and can be downloaded without creating a database or cloud environment.
| Measure | Free public release |
|---|---|
| Transactions | 164,968 |
| Line items | 420,016 |
| Returns | 8,762 |
| Revenue | $120,708,096.68 |
That volume is enough to expose seasonal patterns, geographic differences, and return behaviour. It also forces correct grain handling: transaction revenue must not be multiplied when a transaction joins to several line items.
The free release is therefore both a useful dataset in its own right and a practical way to assess whether the broader Maycee product fits a project.
The Tutorial: Free Data to a Local Dashboard
The companion maycee_retail_analytics repository keeps the implementation deliberately focused. It uses Python, DuckDB, Pandas, Streamlit, and Plotly to answer five questions:
- How much revenue did the selected data generate?
- How are average order value and gross margin changing?
- How do monthly revenue patterns compare across 2017, 2018, and 2019?
- Which regions and categories lead performance?
- Which categories combine frequent returns with material financial impact?
Run It Locally
git clone https://github.com/hhphan/maycee_retail_analytics.git
cd maycee_retail_analytics
python -m venv .venv
.\.venv\Scripts\python.exe -m pip install -r requirements.txt
.\.venv\Scripts\python.exe scripts\fetch_free_data.py
.\.venv\Scripts\python.exe -m streamlit run app\app.py
The requirements installation includes DuckDB, Streamlit, Pandas, Plotly, and the Hugging Face client. DuckDB is embedded in the Python process, so there is no separate database server or DuckDB service to install or start.
The commands above use Windows PowerShell. On macOS or Linux, use
.venv/bin/python in place of
..venv\Scripts\python.exe.
How the Data Flows
Hugging Face public Parquet files
                 |
                 v
DuckDB in-memory SQL joins and aggregations
                 |
                 v
Pandas dashboard-ready frames
                 |
                 v
Streamlit filters and Plotly charts
The fetch script uses an explicit table allowlist and downloads only the
published free dataset into the repository's ignored
data/free_v1_0/ directory. The application then:
- Resolves the local free-data directory.
- Reads the Parquet tables directly with DuckDB.
- Selects the latest dimension records and joins facts at the correct grain.
- Restricts transactions and returns to the public 2017-2019 boundary.
- Produces Pandas frames for shared year, region, and category filters.
- Calculates revenue, transaction count, average order value, gross margin, and return-value rate before rendering the charts.
Streamlit caches the prepared public tables, so changing filters does not repeat the full load. The repository also includes automated metric tests and a public-boundary check:
.\.venv\Scripts\python.exe -m unittest discover -s tests
.\.venv\Scripts\python.exe scripts\check_public_boundary.py
These checks verify the public date range and row counts, scan for restricted or secret-like content, and ensure downloaded data is not tracked in Git.
Final Result
The opening view makes the complete 2017-2019 coverage and shared filters visible before presenting five decision-oriented KPIs.
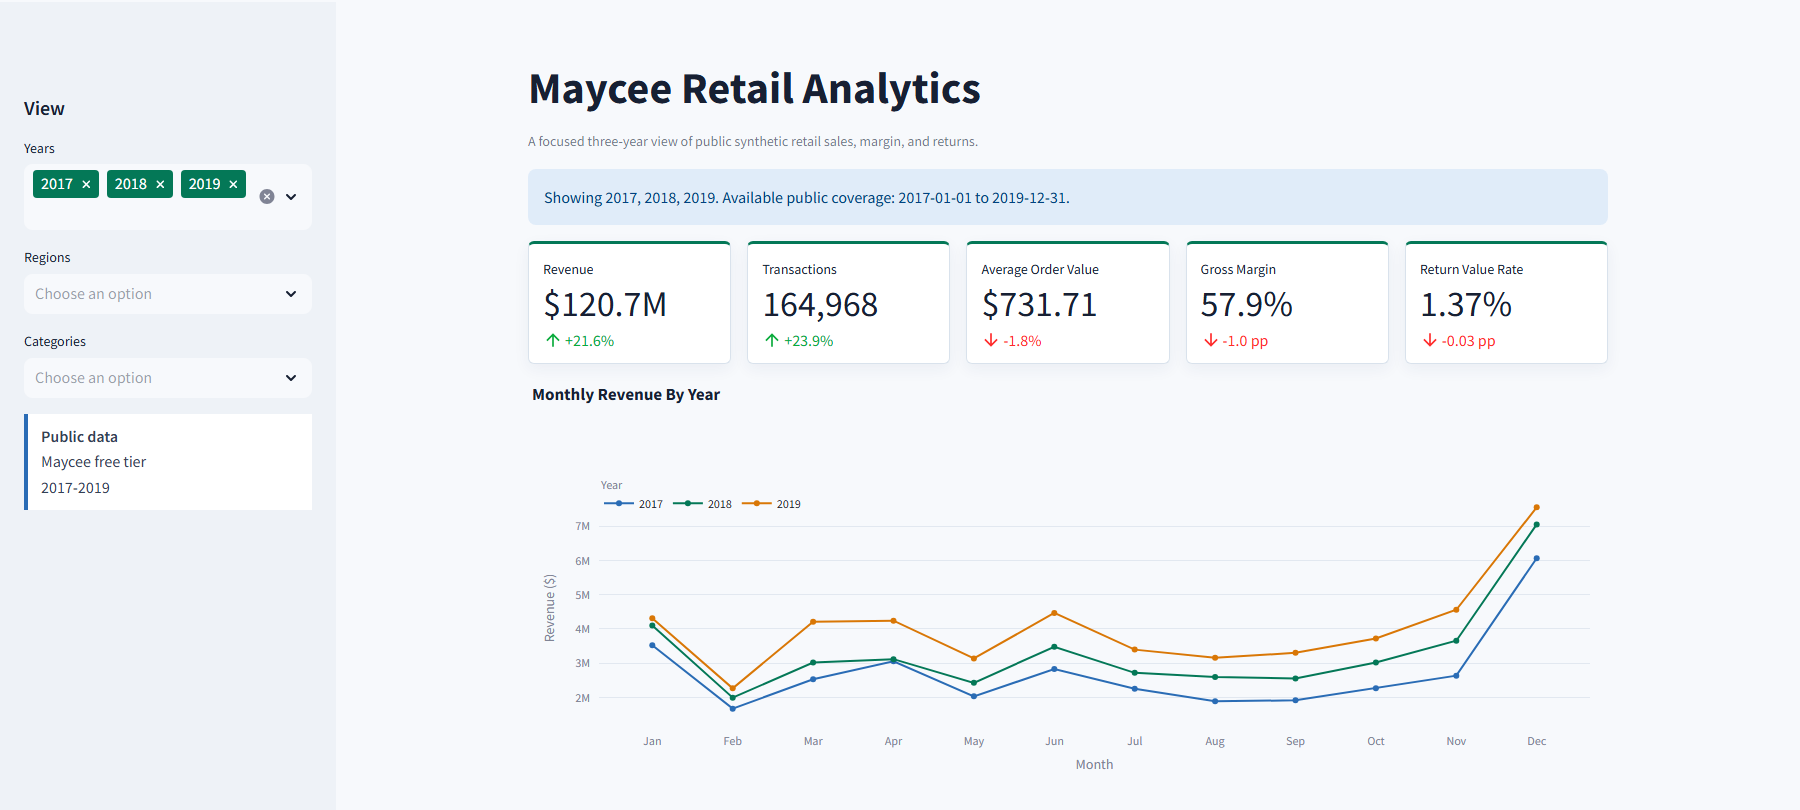
Revenue, transactions, average order value, gross margin, and return-value rate provide scale and operating context in the same view.
The monthly comparison reveals the recurring December peak and the stronger 2019 revenue pattern without asking readers to scan 36 table rows.
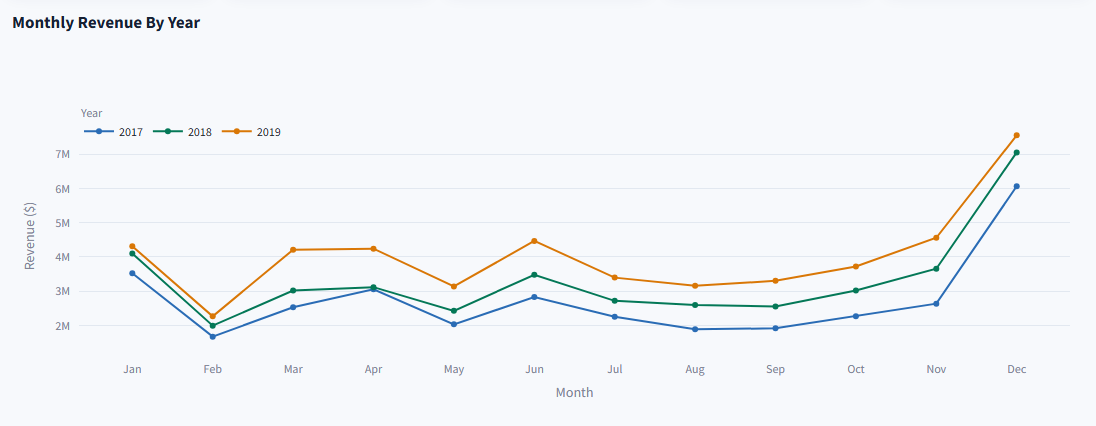
A continuous year-over-year view makes seasonality and the difference between the three public years immediately visible.
The next view separates geographic contribution from category profitability. QLD narrowly leads VIC in revenue, while the category chart shows that revenue leadership and margin leadership are not the same question.
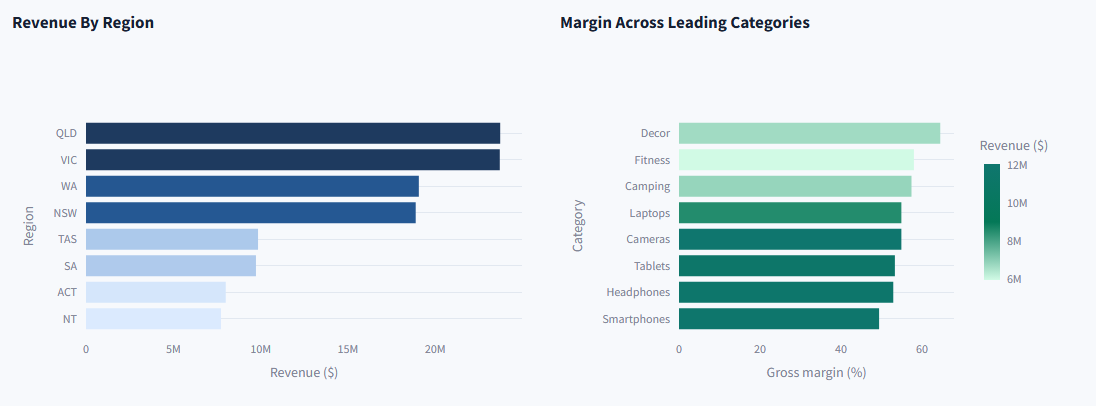
Regional revenue and category margin sit together because they support different but related business decisions.
Returns are analysed as both frequency and financial impact. This prevents a high return count from automatically being treated as the most expensive problem.
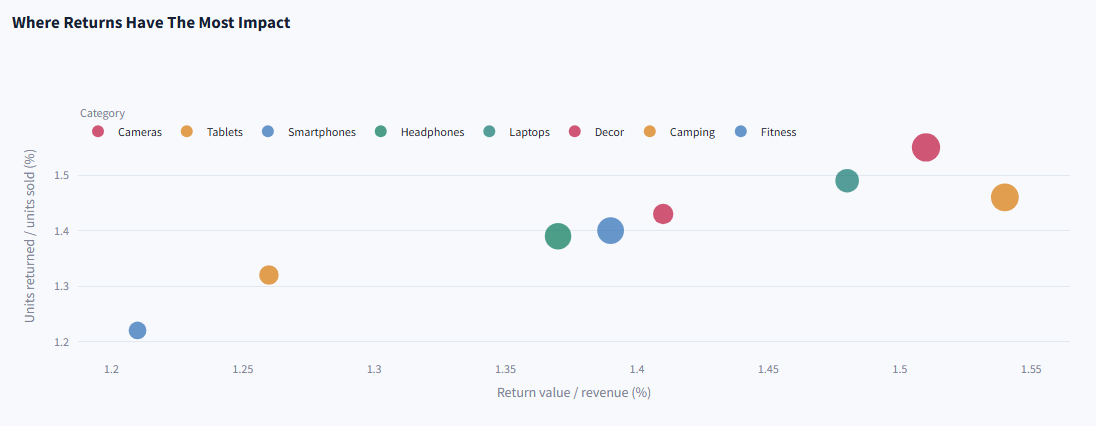
Bubble position separates units returned from return value, while bubble size shows the returned amount.
Where to Go Next
This dashboard is intentionally a starting point. The free Hugging Face release is enough to inspect the model, validate the workflow, and build a credible local analysis before making a purchasing decision.
For a new project, start with the free Maycee Retail dataset and reproduce the dashboard. If you need broader Maycee data for internal project work, review the current scope, licence conditions, and paid v1.0 release options on the official Maycee Retail product page.
Maycee Retail is most valuable when it becomes a working environment rather than a downloaded file. This small Python build demonstrates that path: inspect the public data, test the model, create useful analysis, and then choose the release that matches the work you need to do.